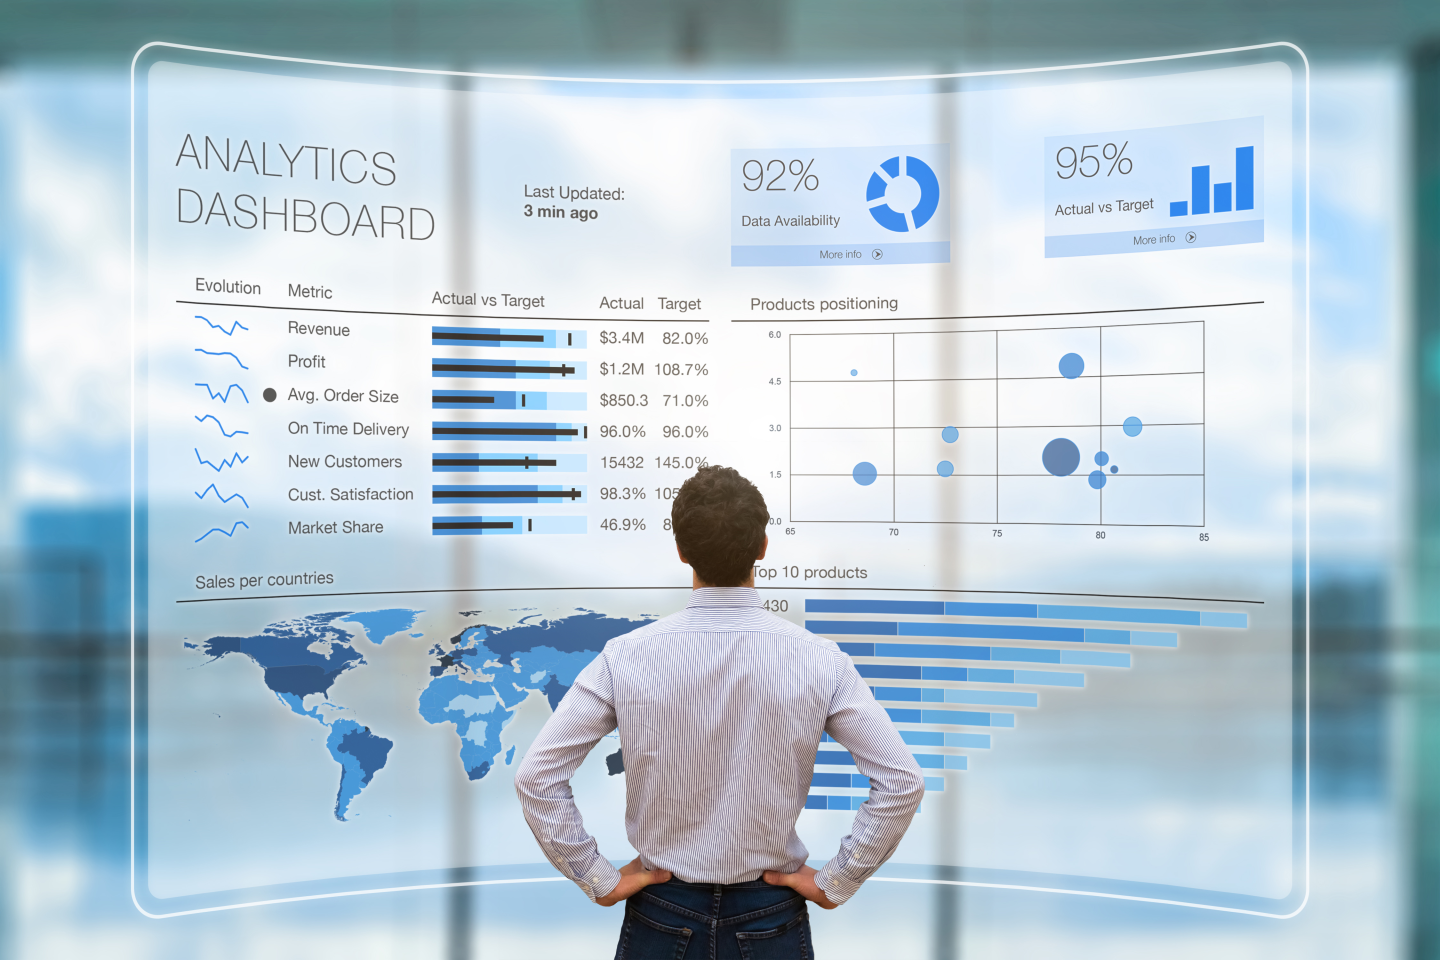
Data visualization and Dashboards
AquaINTEL data visualization services include static visualizations and dynamic dashboards. Static visualizations are useful for presentations, embedded web design, and technical reporting. Dynamic dashboards developed using technologies like Tableau, PowerBI, and more, are ideal when presenting data that changes frequently.
These two approaches have one thing in common – when done properly they support and inform a data driven decision making process.


