AquaINTEL data visualization services include static visualizations and dynamic dashboards. Static visualizations are useful for presentations, embedded web design, and technical reporting. Dynamic dashboards developed using technologies like Tableau, PowerBI, and more, are ideal when presenting data that changes frequently.
These two approaches have one thing in common – when done properly they support and inform a data driven decision making process.
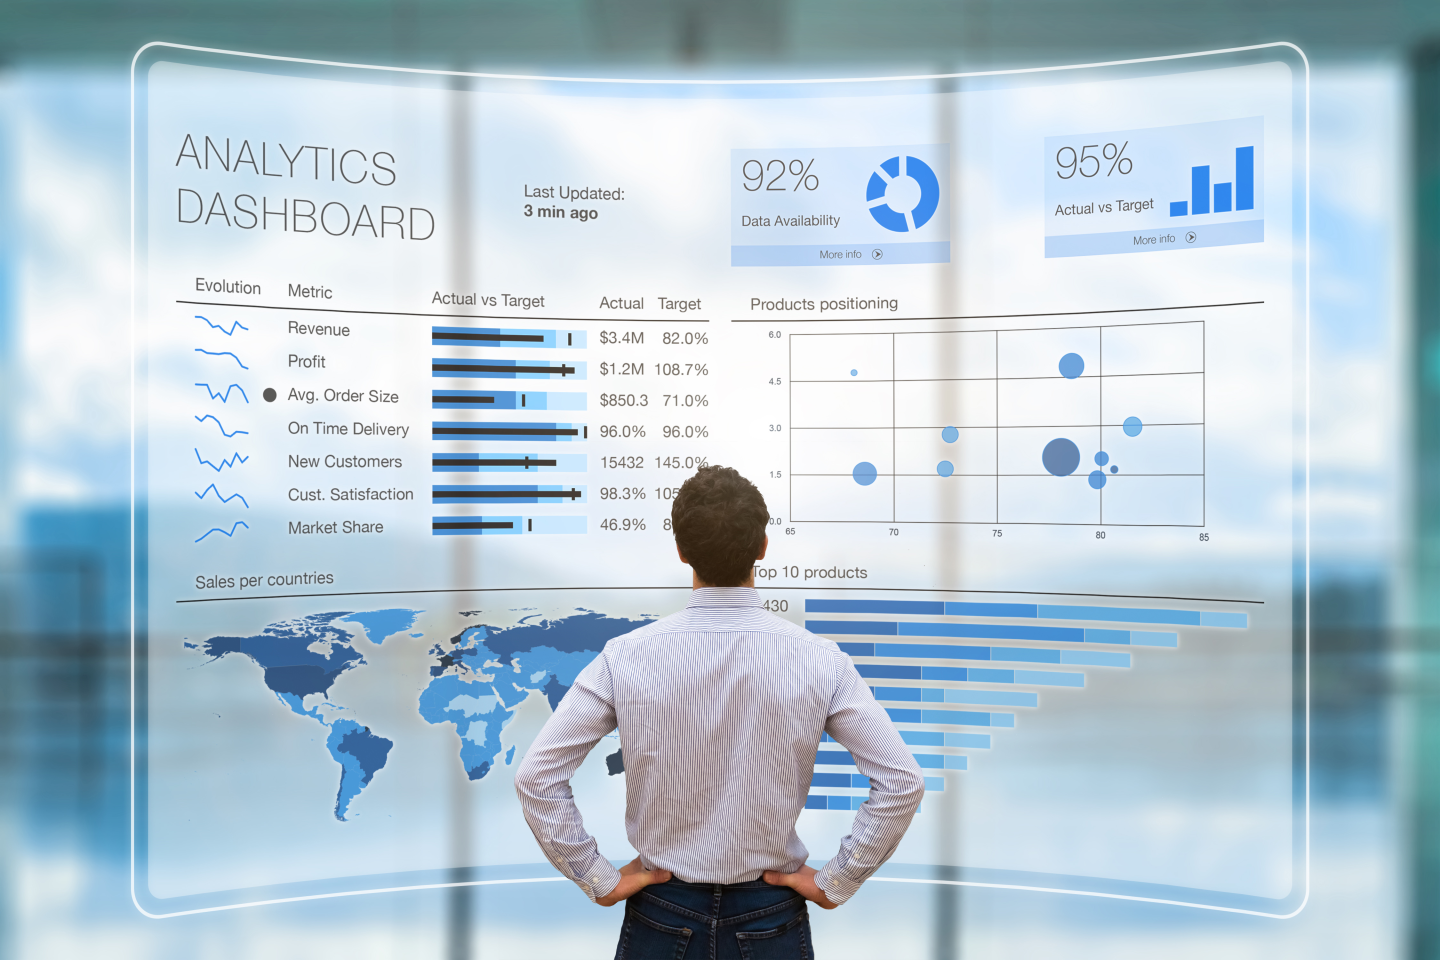
Dynamic Dashboards
AquaINTEL provides Business Intelligence Dashboard development services that integrate and visualize data to answer complex questions. BI dashboards improve compliance, customer engagement, and financial management of your organization. We develop interactive, dynamic, and insightful dashboards that can be interpreted at a glance facilitating the decision making process. We work together with your team following an agile methodology consisting of continuous development, assessment, and maintenance to ensure a seamless implementation. Bring together data from different sources and translated it into actionable insights for your organization.